 [STRAUS Applications] [STRAUS Specifications]
[STRAUS Users Page] [STRAUS Model Archive] [Technical Papers and Tips Contents Page]
[Technical Articles Contents Page] [Home Page] [Previous Page] [Next Page]
[STRAUS Applications] [STRAUS Specifications]
[STRAUS Users Page] [STRAUS
Model Archive] [Technical Papers and Tips
Contents Page]
[Technical Articles
Contents Page] [Home Page] [Previous
Page] [Next Page]


In recent months we have taken a lot of support questions on material nonlinear analysis. Thus it is probably a good time to review the basic concepts and techniques used in material nonlinear analysis.
Beam Elements - The beam elements have a limited nonlinear material capability. This is the elastoplastic beam type selected through the Beam Type option in the beam properties screen. This capability is applicable to axial loading only and allows the beam behaviour shown in the following figure.
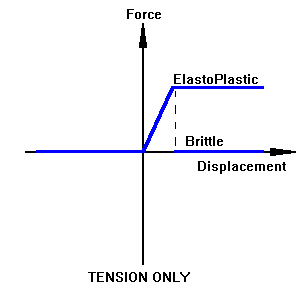
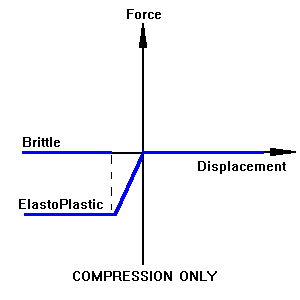
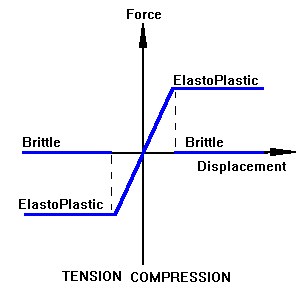
Gap Beam Behaviour
The user can specify the axial force cut off limits for the beams. If the Elastoplastic option is chosen and the axial force in the beam reaches the set limits, the axial force is held constant but the axial stiffness is reduced to zero (i.e. the beam yields). At this stage the beam element does not have a general material nonlinear behaviour for bending or the ability to use an arbitrary stress stain curve to define the modulus.
Stress vs Strain Curve - The plate and brick elements have a general material nonlinear capability that includes the ability to define an arbitrary stress stain curve via a stress strain table. The stress strain table is entered using the Tables option on the main menu. The table can be defined in two ways:
A series of points with stress and strain values. The solver calculates the values of stress and strain between the input points using a linear interpolation. A simplified alternative representation of a stress strain curve is the Ramberg-Osgood equation. In this approach the stress strain curve for various metals has been reduced to the definition of four parameters (Eo, E0.7, E0.85 and n). The values of these parameters for common materials are available in publications such as MIL-HDBK 5 etc. For further details on this approach see the STRAUS manual.
The stress strain curve effectively defines the elastic modulus of the material as a function of strain since the gradient of the stress strain table at any point is the modulus (E).
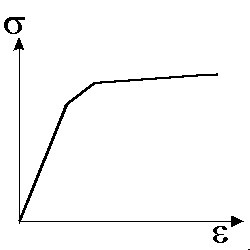
When defining the stress strain curve it is advisable to keep the curve as smooth as possible. If the curve has many step changes in gradient then convergence will be difficult to achieve. Also the STRAUS solver performs best when the stress strain curve has a positive gradient. In practice many curves reach a yield point after which the curve has a negative gradient. This is illustrated in the following figure.
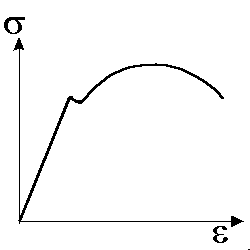
Typical Stress Strain Curve
When representing a curve of this type the solution will converge much more readily if the stress strain curve is simplified as shown in the following figure.
Idealised Stress Strain Curve
While curves with negative gradients like that in above Figure can be used in STRAUS, they can only be used in simple models or convergence may be difficult to achieve. Plate Elements - The plate element properties can be linked to a general stress strain curve that defines the modulus for both membrane and bending behaviour. This is applicable to all types of plate elements including the plate/shell, plane stress, plane strain and axisymmetric element formulations.
In the general plate/shell case, bending actions may be present and thus the magnitude of stress can vary through the thickness of the element. In order to consider the effect of this stress variation on the modulus of the material at the different planes throughout the thickness, the element is considered to be constructed of a number of layers. The stress is monitored at each layer and the appropriate modulus, from the stress strain curve, is used for each layer. This approach allows some parts of the plate element to be yielded whilst other parts remain unyielded. The number of layers is defined in the plate properties input screen using the No. Layers option. The maximum number of layers is 10.
The yield criterion is actually checked at each of the gauss points on the plate for each layer and the modulus calculated at each of these points. The number of gauss points depends on the plate type. The 4 node QUAD 4 element has 4 gauss points whilst the 8 node QUAD8 element has 9. So up to 90 points may be checked (9 gauss points x 10 layers).
In a problem where bending is present it is normal to use the full 10 layers. In 2D analysis (axisymmetric, plane stress, plane strain) only one layer is required since the stress is constant through the thickness of the element. In plate shell problems where bending is minimal and where membrane action is dominant the number of layers may be reduced to say 4.
The stress strain table is linked to the plate properties by entering the number of the stress strain table in the s/e Table option in the plate properties input screen.
Bricks - Bricks can have a stress strain table linked to the properties in much the same way as the plates.
For brick elements strain is monitored at the Gauss points and the modulus at each point adjusted using the stress strain table.
Failure criterion - The plate and brick properties allow the user to select between three yield criteria - Von Mises, Tresca and Direct Stress. The strains calculated from these yield criteria are used to calculate the modulus from the stress strain table. Different criteria are required for different materials.
Most stress strain tables are defined in the positive stress strain quadrant only and the same curve is assumed to apply to behaviour in tension and compression. This type of stress strain curve is shown in figure above.
When using this type of stress strain curve the Von Mises or Tresca criterion must be used since these criteria always produce a positive stress or strain irrespective of whether the stress state is tension or compression or some combination of these. If the direct stress criterion is used with a curve of this type, almost certainly the stress state at some point will be such that a negative stress occurs which is outside the range of the table. In this case the solution will become singular.
If the tension and compression behaviour of the material is different, a stress strain curve can be input for both positive and negative strains. This is shown in in the following figure.
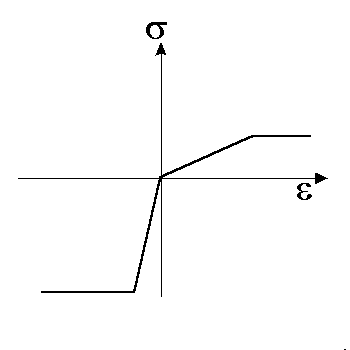
Stress Strain curve with different behaviour for tension and
compression.
If a curve of this type is input the Direct Stress criterion must be used.
Calculation of Modulus from the Stress Strain Curve - STRAUS uses the secant modulus method to calculate the modulus from the stress strain curve. The procedure used for the calculation of the secant modulus is as follows:
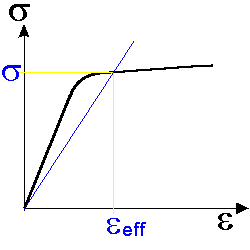
Calculation of Secant Modulus
Geometric/Material Nonlinear Analysis - The geometric nonlinear and material nonlinear solvers can be run together. This is often necessary when yielding is associated with large displacements.
Load Application - In geometric nonlinear analysis the load is applied incrementally to investigate the structural response at different load levels. This helps to ensure convergence.
When running material nonlinear analysis only, the load can generally be applied in one load step. Convergence will however take many iterations.
For problems where both material and geometric nonlinear effects are included, the load must be applied incrementally in small steps. In many models the size of the load steps should be reduced as the amount of yielding increases.
Difficulties in Convergence - Often difficulties are encountered achieving convergence in material nonlinear problems. Convergence problems can arise for the following reasons:
Example - A typical material nonlinear analysis is shown in below.
Simply Supported I Beam
In this analysis a steel I beam is subjected to a large overload and a plastic hinge is formed in the centre of the beam. This problem was run using the material and geometric nonlinear solvers. As the collapse load is approached the load must be applied very gradually (1% steps) to ensure convergence. Collapse occurs when the material completely yields through the depth of the beam and the stiffness of the beam is no longer sufficient to resist the applied load. Complete collapse is signified by a singular stiffness matrix or very large displacements. The collapse load predicted by STRAUS for this model agrees very closely with the traditional manual methods of analysis for a plastic hinge. The deflection of the beam as a function of the applied load is shown in below. Note the nonlinear shape of the curve.
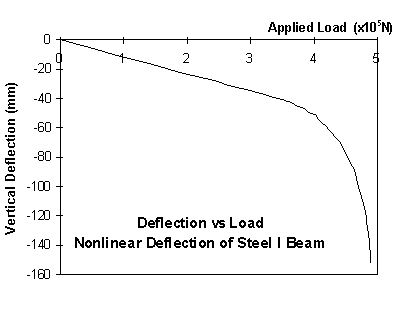
Beam Deflection vs Applied Load
For more information please contact us by
e-mail: hsh@iperv.it


